Corning recovery
- Feb 2
- 3 min read
At Tricio we look at charts in order to gauge investor behaviour and sentiment. Lost in the metals meltdown last week and big swings in other markets was the rally in the Corning share price which finally met – and is breaking above – the $113.29 high from 2000. Better late than never? The company is probably best known these days as the supplier of Gorilla glass to mobile phone makers. They also provide optical fibre products for AI data centres, which is the story that has been driving the share price higher over the last few years (and especially over the last few months). A news report highlights the tie-up with Meta which is currently goosing the share price.
For our purposes, we are putting the share chart in our ‘canary in the coal mine’ column as one to watch if AI hopes are being fulfilled (productivity and profits) or are being missed.
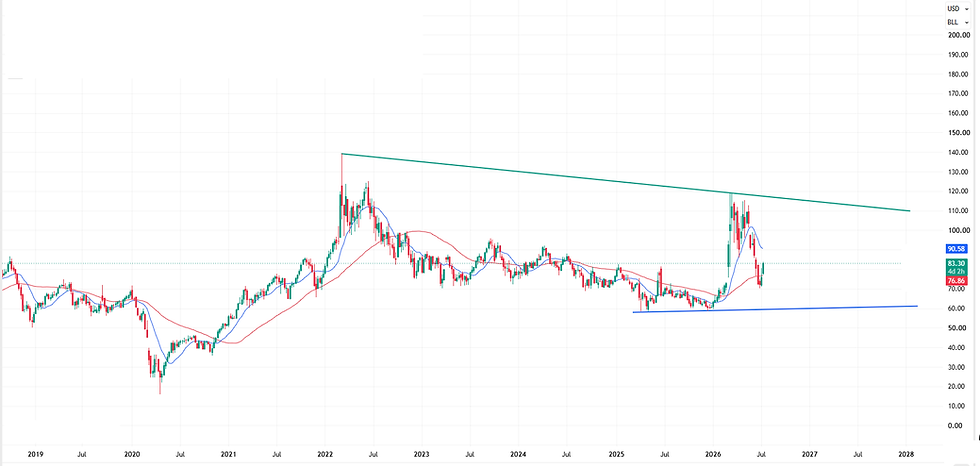
Technically bulls will be looking for sustained gains above $113 to test $120 with eventual gains open towards $150 (bull flag measure). The share is trading at a trailing PE ratio of 59.96 and a forward PE ratio of 35.61, which are not cheap.
Some investors believe it is better to travel than to arrive. Now that the momentous all-time high from 2000 made before a very big stock market crash has been surpassed, the risk has shifted to disappointment again. This makes support levels important to watch. Holding the 13-week moving average ($90 area) will be important ahead of the $77 area (congestion) and the 50-week moving average ($67 area). The psychological $100 area may be seen as a near-term pivot point ahead of these.
Hope for the best, plan for the worst.
Of note is a stock market comment from late 2000 – ‘Corning is currently trading around 72 times 2001 estimated earnings per share (EPS) of $1.36. The market as a whole, as measured by the S&P 500, is trading at about 23 times expected 2001 EPS. Considering that Corning is expected to grow earnings 27% in 2001 compared to estimated growth of the S&P 500 of 9%, a conservative multiple based on the market average would be about 46 times 2001 EPS. Other than this year, Corning's price-to-trailing earnings ratio (P/E) over the past 10 years has only been above 35 once, and that was last year, topping off around 66. The valuation-minded investor might see Corning riding a little high these days. However, this isn't the same company it was just a few years ago. Demand for its rapidly growing products -- fiber and fiber cable, flat-panel displays, and photonics -- is stronger than ever. Third-quarter results will reflect photonics sales doubling over 1999 to $250 million, and strong flat-panel display sales growth of 75% year-over-year. Optical fiber led the way in the quarter, and the company expects continued strong growth in that area, along with stable pricing. It's not at all unreasonable to expect premium multiples continuing into the future based on better-than-expected earnings and the bright outlook of optical networking.
On the heels of three straight quarters of upside earnings surprises, on Monday Corning will officially announce its fourth. Since it shed its stagnant housewares division and dove headfirst into optical networking and advanced material products, the company has outgrown its image of a lumbering conglomerate and is moving along at top speed. In other words, Corning is out of the frying pans and into the fiber.’ The Motley Fool
The share price hit a low of $1.10 in 2002.
Gerry Celaya, Chief Strategist
Corning (weekly chart, semi-log with 13 and 50-week moving averages)


Comments