Disappointment in a share continues
- Apr 17, 2024
- 2 min read
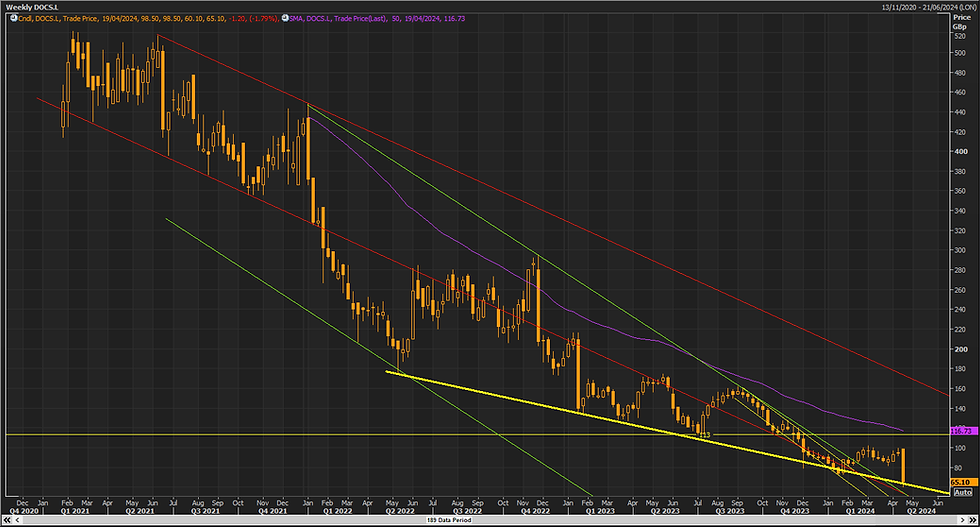
The drop in the share price of Dr Martens extended further on Tuesday as the company rolled out another profit warning (weekly chart below). We looked at the share in previous blogs on 30 January 2023 (Charting Disappointment in a Share) and on 14 November 2023 (Why do investors give up hope?). Simple bear extension risk to 80p was pointed out, and a bunch of reversal criteria that needed to be seen to confirm a trend reversal (and improve sentiment). The slump in the share price in November was on the back of a UK broker lowering their outlook to ‘equal weight’ from ‘over weight’, with a lower price target of 140p. Needless to say, this price target now looks very, very bullish from current levels (near 65p).
We look at charts to see what investors (and speculators etc.) are doing. It is a check on supply, demand and sentiment for the share. The chart below underlines the disappointment that set in after the IPO and the lurches lower in the share price. We have argued that fans of the boots would be better off buying them, rather than the share, in the past. What about now? Technically, there is still very little love found for bulls on this chart. Yes, the big fat yellow support line is currently under pressure, and the share has marked this out as a ‘demand line’ in the past. This is an old school chartist term for a line that marks where ‘demand’ for the share increases (relative to supply) and prices can climb higher from. The problem of course is that in a downtrend, the share needs to break resistance before the chart starts to suggest that sentiment is improving. Bounces off support lines can be interesting, but unless higher highs, higher lows and a defined uptrend forms, downside risk is not eliminated.
This keeps the focus on the horizontal yellow line near 113p as the resistance line to regain (along with the 50-week moving average near 116p) in order to improve the technical picture. A turn above the 160p /175p area is still needed to really confirm a base and give upside swings a big thumbs up. Right now? Bottom fishers may be getting interested on the view that a lot of bad news should be in the price by now. This sentiment can persist even if the share price lurches lower yet again – and funny enough the lower the share price goes, the more some investors may think that surely it can’t go any further, right? Which is why we look at charts. Sure, the temptation is to place a marker on the table, and see if a pullback to the 80p or even 100p area can follow. Just be wary of the trend (down), and consider having some sort of risk control in place. Again, the boots are great. The share price? A lot lower than it was last year. Bear risk? Simple extensions point to 40p and even 10p now, eek! Ideally, consolidation will be seen instead and an eventual turn higher, as we are natural optimists. But for now, there is really not a lot on the chart to suggest that sentiment is improving.
Gerry Celaya, Chief Strategist


Comments