MSFT at the tipping point
- Mar 20
- 2 min read
At Tricio we focus on economic cycles, market structures and investor behaviour in order to help clients navigate markets with a medium to long-term investment outlook. We often use charts as a gauge of investor sentiment and behaviour.
We posted a blog a few months ago about the meltdown in Microsoft shares from their all-time high, pointing out why we thought this mattered. In summary, the fund management industry changed with MSFT as the tech share became a staple for US and momentum funds for many decades. Careers and pension funds were made by exposure to this share. Fund management share selection changed from ‘blue chip portfolios of dividend paying stocks’ to ‘who cares about the dividend if the share price is rocketing higher’. MSFT, of course, did finally start paying a dividend!
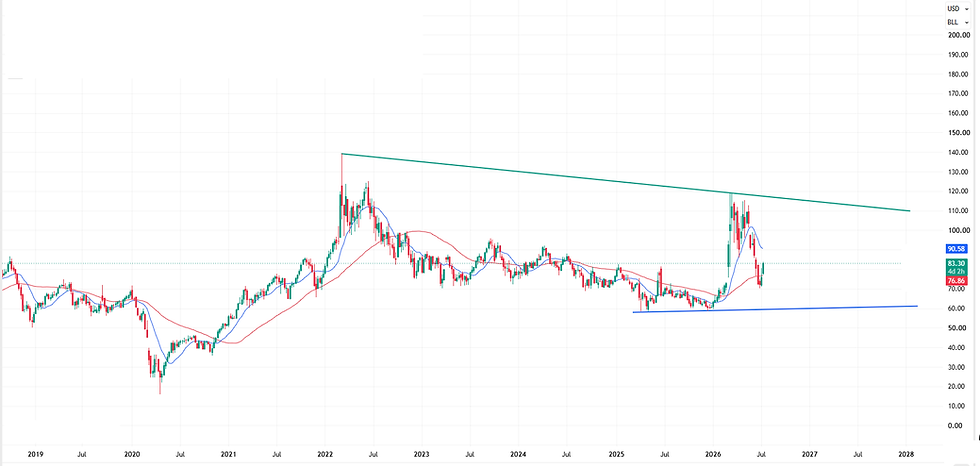
The long. term chart below (weekly, semi-log with 13 and 50-week moving averages) shows that rising support lines have given way or are being pressed. The share price is below the 13 and 50-week moving averages, and the post-US war on Iran bounce in early March failed to hold or gain traction.

The shorter-term chart below shows the tumble in the share price from the probes above 550+ that failed to extend higher on two occasions in 2025. If MSFT loses the 380 area then a drop towards the 340 Trump tariff tantrum April low area will be open. Perhaps more importantly, on these charts, rising red lines near 210 and 180 could be exposed for testing.
Investors could be trimming historical winners to buy other ideas or asset classes – fair enough. And/or they may be taking the view that MSFT as a pc/business software company is vulnerable as AI takes over the world. Who needs MSFT if AI is doing all the number crunching, writing all the documents, sending and responding to all the emails and holding all the Teams meeting with other AI? For those that like the share and sector, current levels may be attractive. However, catching a falling knife is tricky, sometimes it is better to wait until it hits the floor to see if the tumble is over. In this case, we will continue to watch attempts to regain the 13-week moving average as a signal that buyers (demand) are starting to overcome selling pressure (supply).

For further information on our research insights and our ‘Ask a Buddy’ CIO service please contact us at info@tricio-advisors.com
Gerry Celaya,
Chief Strategist


Comments