Nokia rising… really?
- Feb 10
- 2 min read
At Tricio we like to look at charts in order to gauge market sentiment and investor action.
In our recent AI podcast my colleague James Chu, Head of Investment Solutions, noted that Nokia shares caught investor attention last year on some AI hopes. The company has dialled into this trend, and their comments at an AI conference last year may be worth reviewing. For many investors of a certain age Nokia is the poster child of ‘what could have been’. At one point they were the dominant mobile phone provider, but then they lost their way as phones became more ‘smarter’ and their share price reflected this.
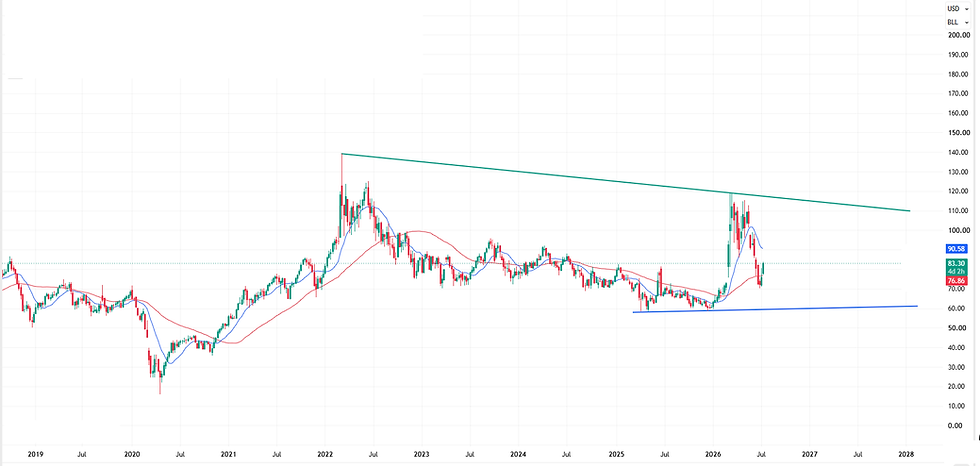
The chart below shows that the share is at an interesting juncture. It is a long-term view (weekly, semi-log with 13 and 50-week moving averages) with potential chart targets shown by the arrows.

The break above the falling red line (resistance, or supply line) makes the first two arrows potential targets, near €11 and €25. These are simple extension targets from a ‘swing measure’ and a ‘breakout extension’, respectively. The falling purple line is a potentially bigger barrier and if broken (near €6.60) a €34.60 target could be in play on a simple extension from the 2012 low/line from the potential breaking point. Risk/support is placed at the falling red line/50-week moving average (near €4.70) ahead of the April 2025 Trump tariff low near €4 and the key long-term support level near €3.40 (summer 2025 low area).
Chase the upside? Confirmation of further upside potential will be given on a break of the purple line (just above €6.6 now) and if dips can hold the falling red line/50-week moving average. Another share to watch as the AI story rolls into 2026.
Gerry Celaya
Chief Strategist


Comments