Still watching Walmart
- Jun 1
- 2 min read
At Tricio we look at charts in order to give some insight into investor behaviour and sentiment. Back in August last year we published a blog on Walmart where we pointed out the importance of the company as a gauge of the US economy and labour force, along with key chart support levels and the bullish case for gains to $110 and then $120.
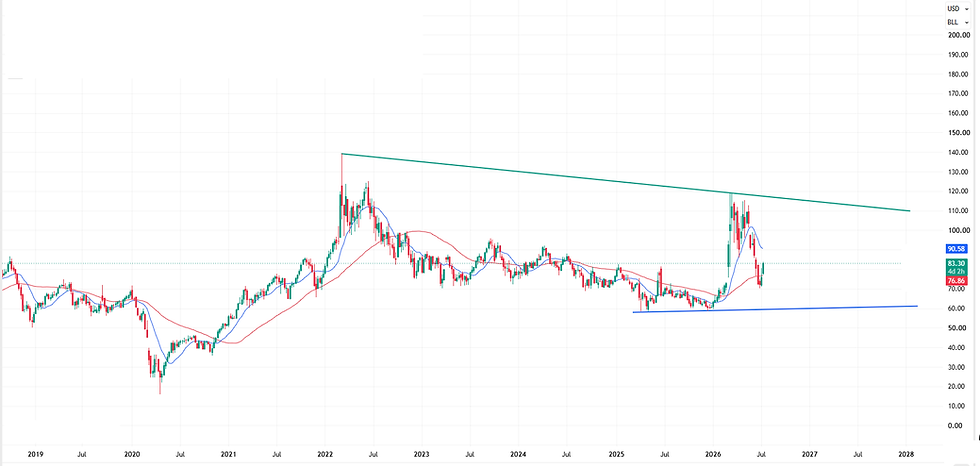
A few quarters later and the share is worth looking at again as the $110/$120 targets were met and exceeded. But the chart pattern of the share price is worrying now as sellers have stepped up over the last few weeks. This could be a simple rotation out of consumer staples in order to fund more AI/tech purchases as chasing bullish momentum may be driving stock market flow. The weekly chart below (semi-log with 13 and 50-week moving averages) shows a potential double top in WMT (peak near $135) with the recent turn below the midpoint ($118) leaving losses towards $101 at risk. This would put the share below the 50-week moving average ($112).

The recent tumble in the share price has already broken the steepest rising support line with the next two rising support lines near $73 and $61 (respectively). Key support from the April 2025 Trump tariff pullback low is at $79.81 ahead of these lines.
The company is interesting as it is the largest private employer in the US (and the world, according to Wikipedia!) and can top the list of companies with the largest revenue. As a gauge of US consumer sentiment (as we often like to say, “when the going gets tough, the tough go shopping”) Walmart is caught up in the ‘K-shaped economy’ that analysts are focused on. If the pullback in the share price turns from a pullback in a bull trend to ‘is this 2022 or worse again?’ fears, then bigger questions about the resilience of the mass consumer may be asked. With the Fed potentially set to turn from a rate cut bias to actually raising rates over the coming quarters, this may hit investor sentiment as well.
For now, watching the 50-week moving average to see if buyers (demand) step up on approaches. Sustained losses (weekly close?) below this level would shift the focus to the $80/$60 broad chart support zone. If the share draws out buyers on approaches to the 50-week moving average though, then there will be some chances of a pullback to the 13-week moving average and potentially higher. Bull targets? Swing measures point to $190 now, but a lot (a lot) depends on nearby support enticing buyers to step up again and avoiding a turn below $100.
For further information on our research insights and our 'Ask a Buddy' service where we help clients manage risk and build resilient portfolios please contact us at info@tricio-advisors.com
Gerry Celaya, Chief Strategist


Comments