Tesla pullback extends
- Apr 7
- 2 min read
At Tricio we focus on economic cycles, market structures and investor behaviour in order to help clients navigate markets with a medium to long-term investment outlook. We often use charts as a gauge of investor sentiment and behaviour.
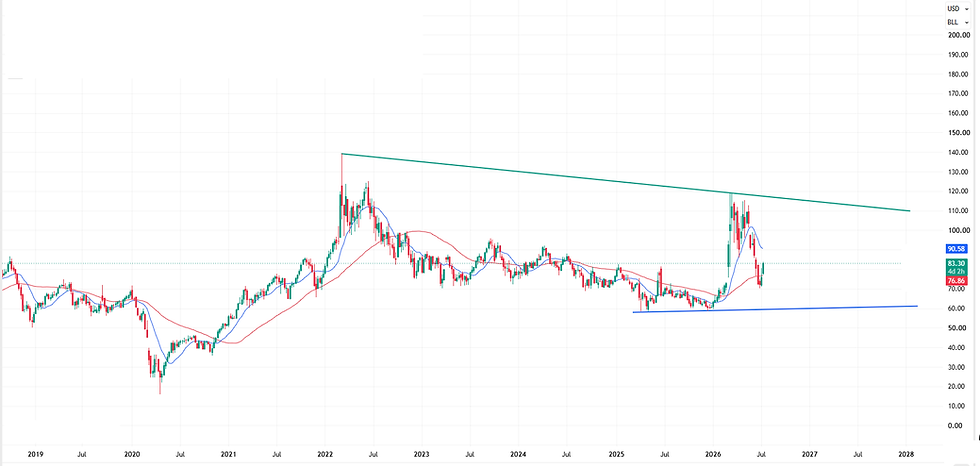
The last time that we focused on Tesla was in March 2025 when the share price was falling like a rock (down over -50% from the recent all-time high at one point). Now, just over a year later, the share is down over -30% from the most recent all-time high. The long-term chart below (weekly, semi-log with 13 and 50-week moving averages) shows that the share has effectively marked time – or swung around sharply, depending on your investment/trading habits, for a few years now. The broad red channel lines are bullish, but very, very wide. The top line is near $530 and the bottom line is near $120 now. This underlines the view that TSLA seems to trade a lot more on sentiment than other large cap tech shares do, with a lot of focus on future earnings. As an example, the trailing P/E is over 330 while the forward P/E is a more reasonable 172….

The short-term chart below shows that current bear pressure is seen from the slide below the 13-week and 50-week moving averages. The ‘broadening triangle’ that is marked by the blue lines is seeing pressure on the lower support line now. These can be very tricky patterns to trade. The risk is that the support line gives way and further slippage to the next rising red line follows (near $300). A break of the latter would open up the second rising red line for testing near $220 below this. The risk is that a very simple long-term double top pattern could be building from the December 2024 ($488) and December 2025 ($498) peaks. The potential top midpoint is near $214, and if this gives way on a sustained basis then chartists will be mulling over the notion of a negative value to the arithmetic target. On a percentage extension (semi-log chart) swings towards $100 would be open.

Any good news? The challenge of the falling blue line support could draw out buyers – this is a potential demand line after all. If not here – then the first rising red line near $300 should be a decent barometer of investor sentiment and potential demand for the share. Bulls need to see a rally above the 50 and 13-week moving averages to suggest that sentiment is improving over the coming weeks. Then up to the blue/red lines on a bigger rally.
For now, we note the pressure on support, and the risk that this extends further. The company still has a decent weight in the NDX (over 3%) and over 1% in the SPX. But, if the share price falls relative to the indices, it will have a lower weight, the magic of market cap indexation.
For further information on our research insights and our ‘Ask a Buddy’ CIO service please contact us at info@tricio-advisors.com
Gerry Celaya,
Chief Strategist


Comments