Long-dated bond yields found buyers (but look for JGB yields to keep rising)
- Oct 21, 2025
- 3 min read
At Tricio we look at charts in order to gauge investor sentiment and behaviour. Back in September we looked at long-dated bond yields in a blog. Our bottom line argument was that UK, US, French and German bond yields may work lower. We looked for 30-yr. bond yields in Japan to have a different trajectory though and continue to rise in time.
Six weeks or so later is not a realistic investment horizon to make any sort of judgement call. But on the other hand, sing while you are winning, right? We still look for our base argument to hold, but bond yield trends can be tricky.
The 30-yr. JGB yield chart (weekly, below) still shows the break above 3%. Watch the next few months of the likely new PM to see if pressure on the BoJ builds to hold back on rate hikes – as the market seems to expect. For bond investors this will be a coin toss. Rate hikes should mean higher yields. No rate hikes and letting inflation rip (well, rise a bit…) should leave long-dated bond yields to rise. Hmm… We still look for 4% potential here.

The US 30-yr. bond yield (chart below) saw the 5% area cap hold, with a turn below the 13 and 50-week moving averages seen. This may leave probes of 4.35% and then 4% open if investors continue to step into long-dated bonds. Keep medium and long-term risk at the 5% area cap. All eyes will be on the CPI reading for September out on Friday and any clues on inflation and jobs ahead of the Fed meeting on the 29th.

French political risk is still bubbling away, but the market has become a bit more used to this it seems. The 30-yr. bond (chart below) shows that the 4.5% resistance area is still holding and yields are below the 13-week moving average. The 50-week moving average is near 4% and this remains a pullback target.

German 30-yr. bonds (chart below) found buyers ahead of the 3.5% area, and the drop in yields below 3.25% puts the bond back into a potential range trade. Watch the 50-week moving average just below 3% as the pivot to break for a pullback to 2.5% open. The bottom of the range since late 2023 is at the 2.25%/2.00% range. We don’t look for a bond yield pullback to this area unless a big flight to safety trade or major slowdown in the economy is seen.

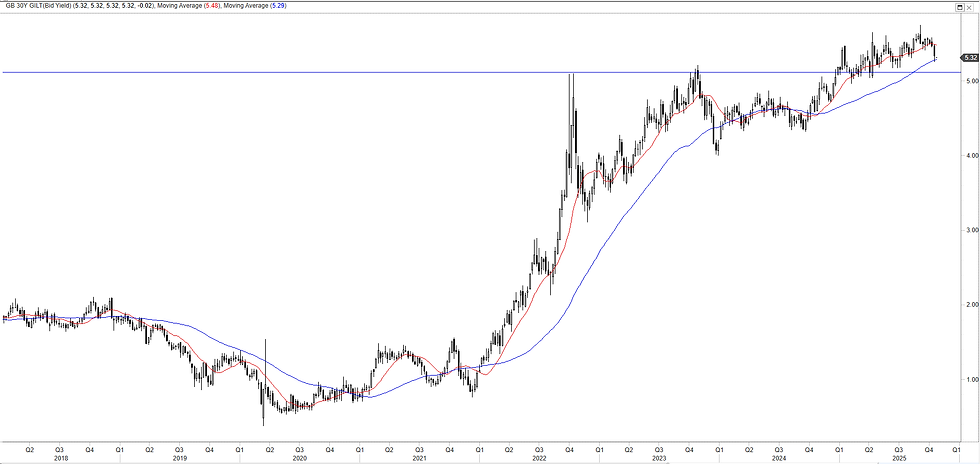
Finally, in the UK the 30-yr. gilt yield (chart below) pushed up to 5.75% (5.6% when we wrote our early September blog) but yields have dipped since then. We were looking for a turn in sentiment, and this may be happening. Much depends on the 26th November Budget of course. But our chart view would favour a turn below the 50-week moving average (at hand near 5.3%) for a drop towards 5%. The latter remains a pivot area for 4.5%/4.25% if broken. Very early days for this, but it does seem that 5.75% may be the new range top, and 6% won’t be seen in this cycle. Gilt bulls will get confirmation of the next leg lower in gilt yields on a sustained drop below the 50-week moving average and a turn below 5% - fingers crossed!
Gerry Celaya, Chief Strategist


Comments