Signs of weakness
- Nov 4, 2025
- 6 min read
At Tricio we look at charts in order to gauge investor sentiment and behaviour. Shares have had a remarkable run higher since the early April Trump Tariff Tumble. Many global equity market indices have hit all-time highs again and again and some valuations look pretty lofty. It is understandable that investors will be looking for any signs of weakness that may lead to a bigger market correction or reversal. The simple way to look at this is the tussle between fear and greed which is seen in all cycles. But can we look at certain shares or sectors that could lead the general market?
There are many guides to market timing, and our long held view is that ‘time in the market’ beats ‘timing the market’ for most long-term investors. We have written about this in many of our publications and blogs, including a blog in October 2024 and an earlier blog in March 2022, Fans of US stock market investment history will recall Norman Fosback and the view that if the Fed raises rates three times in a row then stocks will tumble, and if they lower rates two times in a row then stocks will rise. Don’t fight the Fed! So why worry now as the Fed has resumed their rate cut cycle? While history is a good thing to keep in mind, every cycle is different. This time around, it does seem that the bull market is discounting a lot of potential worries and risks that may come back to haunt shares. Let’s take a look at a sector and a couple of shares to see if they give any insight on sentiment.
Back in September 2024 we wrote a blog about the Philadelphia Stock Exchange PHX Semiconductor Sector index (SOX). The bottom line of the blog was that we liked the upside in the index and we highlighted ‘bottom fishing’ chances in Intel. Now? The chart of the SOX below is a weekly semi-log chart with a price oscillator showing the difference between the weekly close and the 50-week moving average (red line, lower window). The indicator is back to frothy levels and the SOX index is close to rising trendline resistance. We still like chips, but don’t be surprised if the index comes back to the middle rising blue line near 5,300 over the coming months, which is also where the 50-week moving average comes in now. In other words, markets rarely rise in a straight line forever, and while the bull channel in place since 2009 could extend for a while, odds are that the SOX index may press support levels now and then within the channel.
SOX - Philadelphia Stock Exchange PHX Semiconductor Sector index

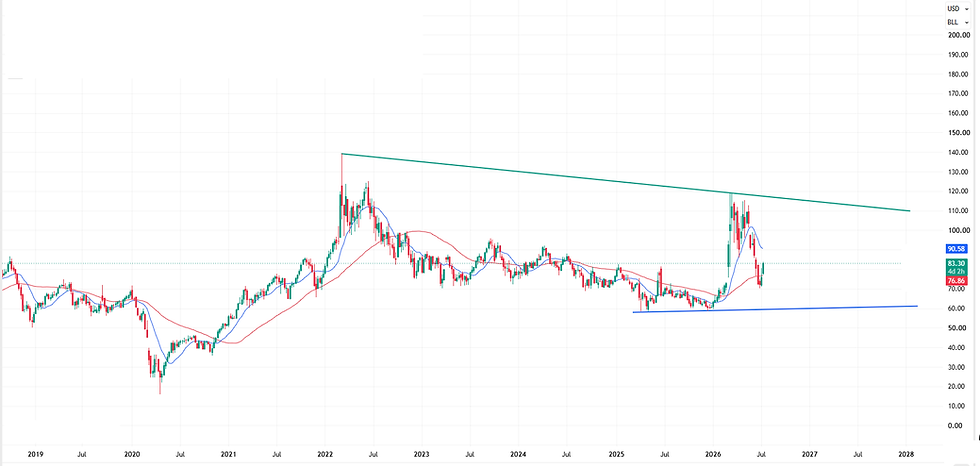
Back in August 2025 we wrote a blog about Walmart as this is the largest private employer in the US and could provide insight into how US tariffs were being passed on (or not) to consumers. We mentioned the risk of a ‘double top’ but stuck to the view that most potential tops are actually bull flags, and pointed to the $110 and $120 potential targets. Since then the share has run above $109 but then fell back. WMT seems to be sourcing more goods from US suppliers and will be passing on rising import costs as pre-tariff inventory has been run down. Margin compression is never great for companies, but WMT has pointed out in the past that if they passed on all the rising costs to consumers there is a considerable risk that sales would slump.
For our purposes, we note that WMT turned down in 2018 and 2022 as the market did. So the pullback to the 13-week moving average (and just below it now) is worth watching. See if the drop tests the 50-week moving average near $97 next, with rising line support at $91 key below this (blue). A break of this would set sights on the flat red line near $80, the Trump Tariff Tumble low. A break below the latter would be a really big negative signal if seen. Right now, just leaning to a push to the rising blue line, see if buyers step up if approached?
Walmart

Financial media headline watching is always a risk for long-term investors as the whipsaw approach to events can turn heads around. However, when a leading share hits a brick wall and breaks down, this may be worth looking at. Chipotle was a market darling since 2018 and really exploded higher in 2023. The last two years of gains have been wiped out and a break below $30 is at risk for a push lower towards $24, levels last approached in 2022. High beef prices and margin compression in a world where the consumer is being pinched have been taking a toll.
Keep in mind that the economists narrative for much of this year is that the top 10% of US earners make up nearly 50% of all sales. While the numbers may add up for accountants, most food retailers would like to make a living from 90% of consumers. If these aren’t shopping as much, they are in trouble. There is a risk that this firms problems are not just specific to them, time will tell. Regaining the red line just below $40 may reduce bear pressure if seen, use the green line near $45 as a key pivot.
Chipotle

The worries over Chipotle may spread to another restaurant chain that is seen as one of the biggest brands around the world – McDonald’s (weekly chart below). They report Q3 earnings on Wednesday and hopefully it will be ‘all good here’ for the market. The chart points out support at the blue line near $289 which is worth watching ahead of the bigger red line near $259. The share price is below the 13 and 50-week moving averages, and a potential rounding top (or sloppy head and shoulders) may be forming. Very early days for this of course, watch resistance at $313/$319 and then $326.
McDonald's

Shifting the sights a bit, and US homebuilders are at interesting levels. We last wrote a blog about this in August 2023 but cover the sector frequently in our research publications, podcasts and webinars. We look at the iShares Home Construction ETF as a proxy for the sector, weekly chart below.
ITB iShares US Home Construction ETF

Back in 2023 we noted downside risks but mostly sided with Buffett in the view that if the US economy avoided a hard recession then the shares may catch up with the market. The sector gains were impressive but peaked in 2024, oddly enough just after the Fed started to lower rates. As an example of ‘buy the rumour, sell the fact’ this sector may be one for history books as lower rates should, in theory, be good for the sector. The problem of course is that US government bond yields fell ahead of the Fed rate move in 2024 and pushed higher and have been chopping around above the summer 2024 yield lows since the September 2024 initial rate cut. The ‘hawkish’ rate cut from the Fed last week, along with the US tariff and immigration policies may undermine housebuilders further.
We are watching the push below $100 to see if a pullback to rising line support near $87 and then $83 is seen. Watch the $82.25 low from the Trump Tariff Tumble in early April 2025 as a key pivot for a break towards $50/$47 (2022 lows). Back to the 2020 Covid lows near $22? This would be a big bear market risk. Right now we are leaning to corrective pullbacks instead but will be focused on probes of $87/$82 as a break below this would signal that investors are souring further on this sector.
Some risks to watch out for are that the Fed has resumed easing, but inflation readings may not fall to target over the coming quarters. Economic activity may hold up enough to keep the Fed from lowering rates to the 3% terminal rate target that money market traders have been looking for as well. This could keep the US 10-yr. note yield in a choppy 4.0%-4.5% range for the most part, with 3.6%-5.0% serving as the range barriers in place for some time now. Watch $107/$110 as resistance to watch now, triggers for $119 and a potential rally to $120/$124 again.
Gerry Celaya, Chief Strategist


Comments