Normal service resuming in US tech?
- Apr 1
- 3 min read
At Tricio we focus on economic cycles, market structures and investor behaviour in order to help clients navigate markets with a medium to long-term investment outlook. We often use charts as a gauge of investor sentiment and behaviour. Our favourite ‘call’ for long-term investors, repeated in our Monthly Insights for April 2026 research publication, is that time in the markets is a better strategy than timing the market. However, it may be useful to look at some key charts in order to see how sentiment may change.
The US war on Iran disrupted energy, broader commodity, money market/FX, bond, credit and equity markets last month. Hopes for a ‘TACO’ resolution fluctuated on US Pres. Trump’s early morning social media posts and random comments when he has addressed the press.
At the moment, it looks like the US is open to an ‘off ramp’ to the war which won’t require ‘boots on the ground’ in Iran. The US troop buildup and deployment of armament to the region continues though. Time will tell if the war does actually end over the coming weeks without a huge escalation in the conflict. A look at the NASDAQ 100 chart, as a gauge of US tech (risk-on) shares, could give insights into investor thinking. The heavy weights of NVDA (8.5%), AAPL (7.6%), MSFT (5.5%), AMZN (4.5%), TSLA (3.8%) GOOGL/GOOG (6.4%) and META (3.2%) show that these seven shares make up 39.5% of the index.
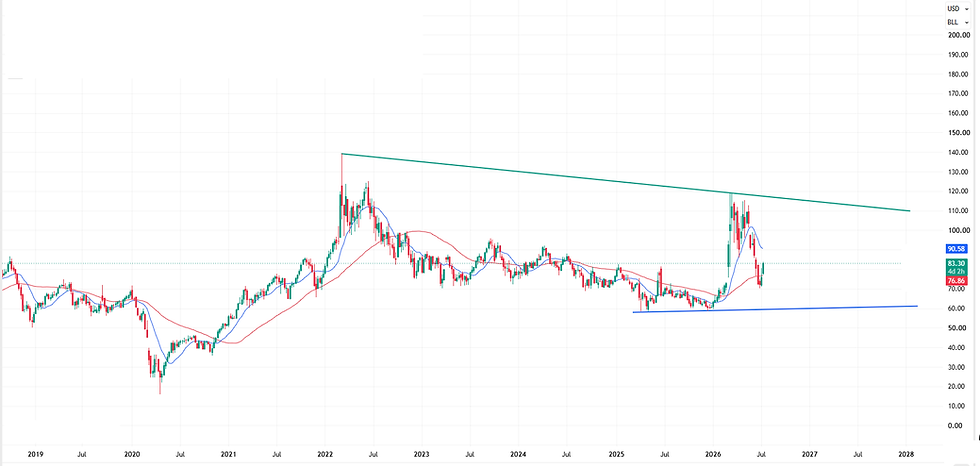
We have used the chart long-term chart (below, weekly, semi-log with 13 and 50-week moving averages) of the NASDAQ 100 since founding Tricio in 2020. We noted in our client discussions, webinars and research publications over the last few quarters that the NDX was in the middle of the broad bull channel (rising blue lines). This could see swings in +/-20% swings within this channel, and still be ‘bullish’ on a long-term view. The tighter red channel has given some warning signals in the past, and this channel support (and 50-week moving average) were tested last week.

The chart below shows a closer view of recent activity. The index peaked in late October 2025, and the US war on Iran knocked back rebound hopes in March. The push below the support line from the red channel and 50-week moving average underlines bear risk as investors soured on key themes (AI spending by mega-cap names, software and search/advertising company vulnerabilities etc.).

Key support was pressed last week and downside risk to the bottom of the long-term rising channel (18,700+ area) is clear. This line has not been tested since late 2022 though, and tumbles since then have found buyers ahead of this channel line. A sustained recovery of the 50-week moving average (23,800 area) and then the 13-week moving average (24,775 area) would give positive signals if seen. Then, normal service may return for bulls and another rotation to the red channel resistance line (27,800 area) could follow in time (assuming that end of war bullishness on lower energy prices, lower interest rates, receding inflation risk, Fed rate cut hopes resumed etc. trumps AI spending/disruption worries for a while!).
New lows in the NDX for this correction (below 22,840 area) , if seen instead, would be a big reversal of the small upturn in sentiment that has started to build over the last few sessions. Downside risk is high, traders are hoping for good news on the war in Iran (quick end, victory declared, Iran lets cargo flow through Strait of Hormuz etc.). See if this pans out…
For further information on our research insights and our ‘Ask a Buddy’ CIO service please contact us at info@tricio-advisors.com
Gerry Celaya,
Chief Strategist


Comments