

Watching US Home Builders for a potential breakdown
At Tricio we use charts in order to gauge investor sentiment and behaviour.
The chart below is the US 10-yr. note yield (weekly chart with 13 and 50-week moving averages). The 5% area is under pressure ahead of the Fed meeting and the risk is that 5.3% (flat line) is tested – and breaks. This would leave the door open for a push to 6% and then 6.80%, the early 2000 yield high.
The combination of a strong US economy, inflation readings that have been running above target for over 5 years, a federal deficit near 6% of GDP, government debt bumping above $40 trillion and AI firms issuing a lot of debt may be combining to drive US bond yields higher.

The US 2-yr. note yield chart (below) shows that this rate, which should be anchored by the fed funds rate (3.5%-3.75% range), is trading above 4.6% now, over 100 bp above the lower band rate. Will the Fed raise rates to a 4.5%-4.75% range?

If the Fed does raise rates by 100 bp or more in a new rate rise cycle their intent would be to slow the economy down to the point that inflation readings come down. Keep in mind that inflation readings are high due to the US war in Iran and rising energy prices, along with other commodity prices. The Russian war in Ukraine lifted prices in 2022 and the current destruction of key refineries and other facilities is seen as putting upside pressure on prices as well.
A key rate to keep an eye on will be US mortgage rates. The chart below from the Fed shows the average US 30-yr. mortgage rate. This hasn’t’ pushed above 7% yet, but the risk is that shift to the 2023 high above 7.5% will be seen if bond yields continue to rise.

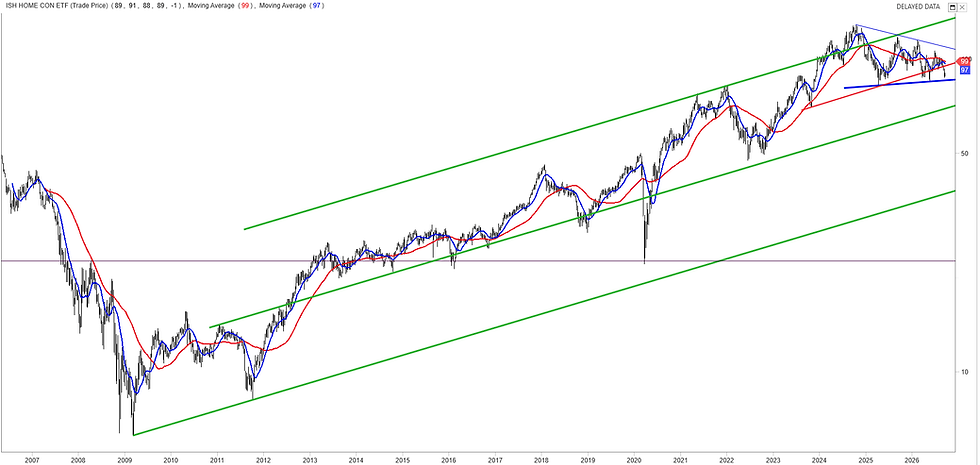
US homebuilding shares (iShares US Home Construction ETF, weekly chart below, semi-log) can be a useful barometer of broader economic sentiment. While AI/tech fever has seen equity market indices in the US and around the world bubble higher over the last few years, this sector has languished. If the ETF starts to slide below the flat blue line ($86 area) then a topping pattern may unfold. This would open up the $70 area (rising middle green line). The big risk would be a bigger slide to the lower green line near $37. We don’t favour the latter, but do recognise the risk of the Trump administration’s policies (tariffs, anti-undocumented workers drive, trade war with Canada, real war with Iran) keeping bond yields high and putting further pressure on home builder shares.
The Fed has all to play for this week. Can Fed Chair Warsh convince the bond market that inflation will come under control and bond yields will fall? And if he does, what would the cost be to the economy?
For further information on our research insights please contact us at info@tricio-advisors.com.
Gerry Celaya,
Chief Strategist


Comments