

Yen reversal
At Tricio we use charts in order to gauge investor sentiment and behaviour. We have been looking for USD/JPY to fall for some time now, and the activity over the last few days is making us a bit happier than we were last week. The weekly chart below (with 13 and 50-week moving averages) shows that the Yen has firmed from the Y160 area to mid-Y155 again. This is putting the Y155 (blue flat line) in focus, and yen gains through this level will se up the Y150 zone for a test. On the chart this is marked by the top flat red line and the rising blue line.
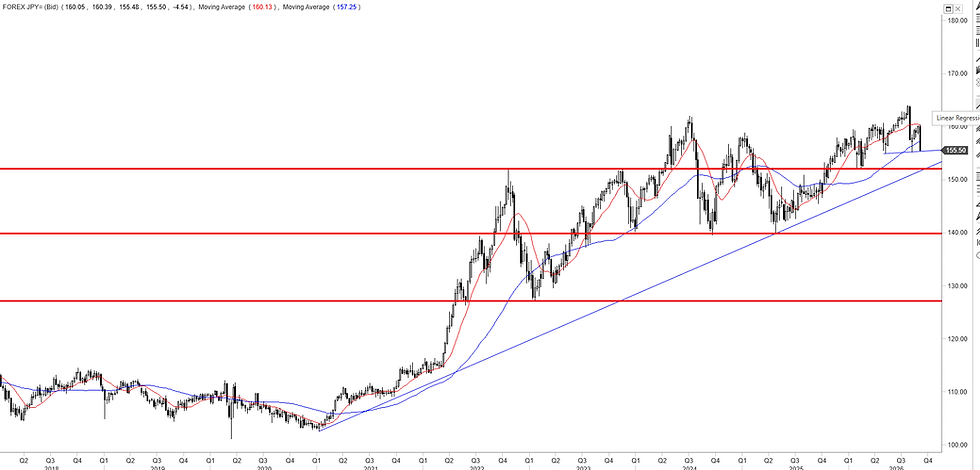
Calling tops is never easy or clever. But, a turn below Y150 would put the fox into the chicken coop for USD bulls and set up the middle flat red line near Y140 for testing. Breaking below this level would trigger a potential double top (Y162 in summer 2024, Y164 in summer 2026). The extension target would be below Y120, but we are looking for the lower flat red line near Y127 to be sticky (to Y125). Easy right? Well…
Upside risk is layered at the Y160/Y164 zone for Y170/Y180 on a break, but with the MoF/BoJ and apparently, US Treasury in the game, breaking above Y164 may be tough.
Faithful listeners of our Currency podcasts will know that John Calverley, our Chief Economist, has been looking for USD/JPY to revert below Y125 for some time, given the underlying fundamentals. We are seeing the 10-yr. JGB yield knock on our long-term objective at 3% now, and the market is looking for a rate hike this month. There are more hikes ahead and the JGB yield looks to be on course for 3.5% and higher.
Our Currency Matters monthly is out next week, if you would like a copy please contact us at info@tricio-advisors.com.
Gerry Celaya, Chief Strategist


Comments